Employers reported 2.7 million injuries and illnesses in 2020, according to the U.S. Bureau of Labor Statistics (BLS). And while this number is down 5.7% from the previous year, there’s still room for improvement. In 2020, these injuries cost companies more than $163 billion in wage and productivity losses, medical expenses, and administrative expenses, in addition to 99,000,000 work days lost. Lagging safety indicators offer one way for businesses to evaluate workplace trends and deploy new processes that reduce total risk.
In this piece, we’ll explore what lagging indicators are, what types are the most common, and how businesses can make the best use of these indicators to improve total safety.
What are Lagging Indicators?
Lagging safety indicators are reports of incidents that have happened in the past. These safety metrics help form the basis for future safety protocols designed to reduce specific metrics.
Consider statistics on injuries that have occurred in the workplace. If lagging indicators show that these numbers are trending up over time, it’s worth companies taking the time to determine if there is a common cause (or causes) and what can be done to address the issue at scale.
What are the Most Common Types of Lagging Safety Performance Indicators?
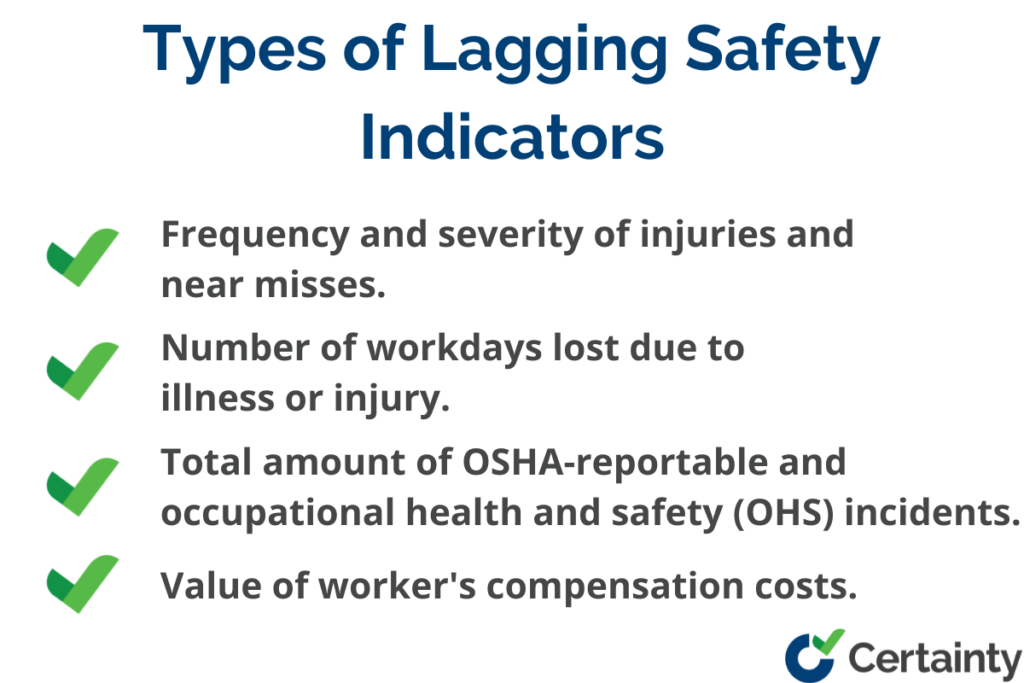
While the specific nature of lagging indicator data will vary based on industry and market type, four broad types are common:
- Frequency and severity of injuries and near misses
This is a measure of both recordable injury rates and the type of injuries that occurred over a specified time period.
- Number of workdays lost due to illness or injury
This indicator evaluates the number of workdays lost and their impact on overall productivity.
- Value of worker’s compensation costs
The value of worker’s compensation costs over the indicator assessment period helps determine if workplace environments are becoming more dangerous.
- Total amount of OSHA-reportable and occupational health and safety (OHS) incidents
More OSHA-reportable incidents suggest the presence of a hazard that puts workers at risk on a daily basis.

The Benefits and Drawbacks of Lagging Indicators
Lagging indicators offer a way for businesses to conduct post-incident risk assessments and determine the direction of safety trends to inform safety programs and reduce the rates of safety incidents. For example, if an analysis of slip, trip, and fall injuries over the past few months shows a marked increase, this speaks to the need for a change in processes.
These indicators can also help pinpoint problems after the fact. If data shows an increase in a specific type of incident — such as injuries sustained while working at a particular station — businesses can draft safety goals designed to address and remediate these issues.
But there are also drawbacks to the use of lagging indicators. Because data about these indicators is collected after the fact, they are naturally reactionary, not predictive measures. This means that while safety practices put in place based on lagging indicators can address the root causes of incidents already observed, they provide no context around the prevention of incidents before they happen.
In addition, if lagging indicators of workplace safety don’t show any immediate issues, companies may become complacent. And depending on the length of time between indicator measurements, businesses may find themselves unaware of rising incident rates until they begin impacting productivity.
How to Effectively Track Lagging Safety Data
When it comes to tracking and measuring lagging safety data, the first step for companies is identifying potential sources of risk. Here, a robust facility safety inspection checklist can help quickly pinpoint problem areas by providing teams with a clear assessment framework.

30+ Audit and inspection checklists free for download.
Next, businesses need to create a schedule for safety audits that sees measurements taken on a regular and recurring basis. This schedule could be weekly, biweekly, or monthly — but whatever the interval picked, it’s important to stay consistent to achieve reliable results.
Finally, companies need to analyze the data they collect, determine appropriate corrective action and create safety training initiatives to help reduce workplace injuries If the value of worker’s compensation costs has increased over the last several measurement cycles, it’s worth sitting down with safety professionals and team leaders to identify and address the source of these issues, both to address any safety management issues and create a plan for improved safety culture.
You may also be interested in:
4 Steps to Perform a Workplace Safety Inspection


